Wednesday, April 22, 2020
Covid Update: Herd Immunity
Subtitle: beware smart people with bad models
Continuing my theme of debunking bad models, I want to address this equation that people keep throwing around that herd immunity happens when the number immune reaches `1-1/R_0`.
Here `R_0` is defined as the number of people who get infected, on average, by a single infected individual in a naive population.
The basis of it is the simple intuition that if one person infects `R_0` people but `I = 1-1/R_0` of those people are immune, then only `R = R_0*(1-I) = R_0*(1-[1-1/R_0]) = 1` people are actually newly infected which means the disease is no longer growing, and any reduction beyond that sees it dissipate away.
The proper application of this is to immunization through vaccination, on the assumption that immunization happens randomly, in which case it's probably about as accurate as the estimate of `R_0` itself is. The "randomly" condition there is foreshadowing the problem:
The above equation does not work, per se, for naturally acquired immunity due to natural disease spread. Lots of people have been treating it as if it does, resulting in models like this:
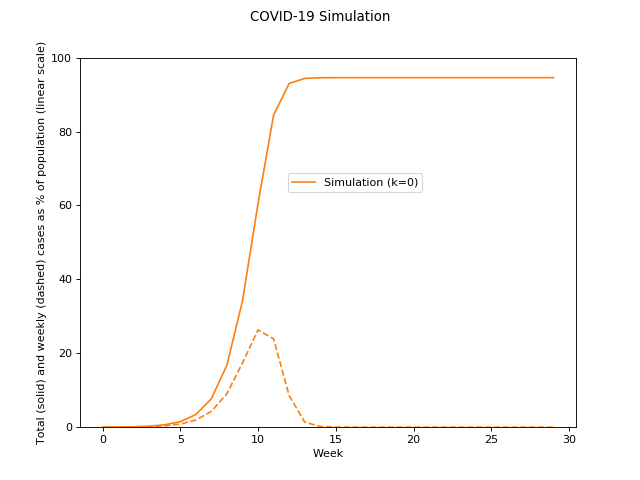
This is using `R_0=2.3`. (A small caveat: For simplicity, I'm treating the average transmission delay, or generation time, as a week for all of these examples, which is wrong but only impacts the horizontal scaling, which is not important here.)
What's happening here is momentum keeps carrying the infection beyond the "herd immunity" level and for subtle mathy reasons the rate of infection ends up following a roughly symmetric shape, meaning roughly as many get infected on the way down as on the way up, so that the final total number infected is roughly twice the "herd immunity" level. (It's "roughly" because as you get into the higher percentages, you have to account for two or more newly infected people being the same person.) In other words, if `R_0 >= 2` then basically everyone gets infected before it's over (under no mitigation).
If we apply this to the flu, here using `R_0=1.4` for the 2017-2018 year (eyeballed--take everything here as qualitative, not quantitative), we get:
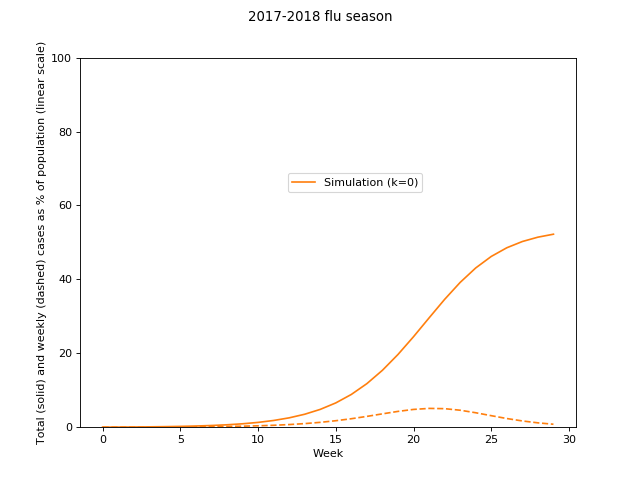
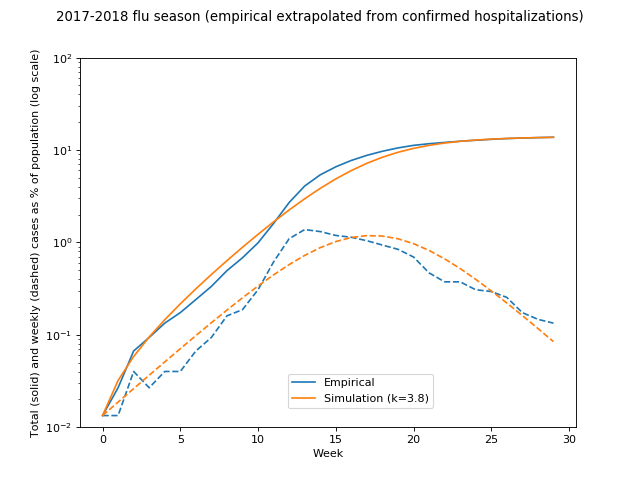
How does that compare to the actual 2017-2018 flu season?
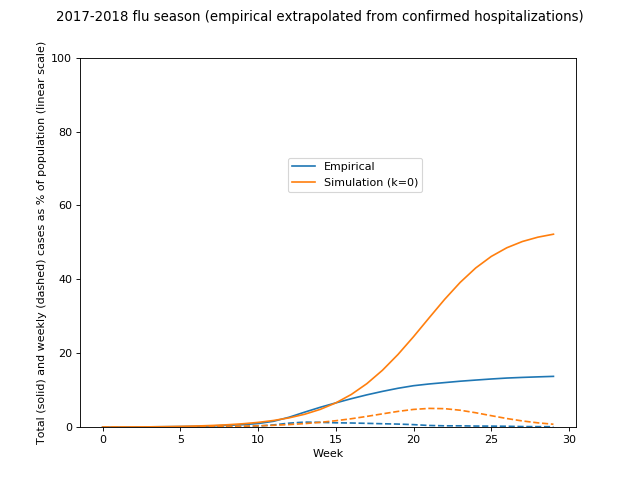
Hmm. Let's look at that in log space:
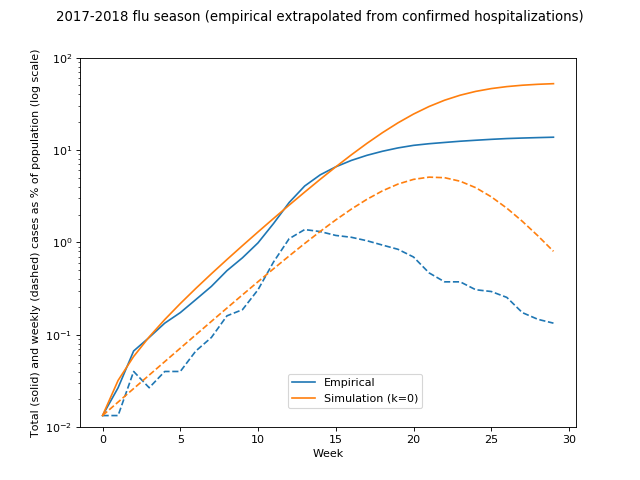
So, this looks pretty good until we start getting into non-trivial fractions of the population infected, at which point the real flu starts slowing down. There are multiple possible reasons for this, such as vaccinations (CDC implies in the ballpark of 10% reduction, so not nearly enough to account for this), weather, and so on.
But there is a more fundamental issue that applies when all other things are held constant: Social mixing is not remotely uniform throughout a population. Consider introverts vs. extroverts, city vs. country peeps, public transportation users vs. drivers. When we calculate `R_0` for a naive population, it is a blend of all of these, but it is dominated by the highest mixers, such as the city-dwelling, public-transportation using extroverts. And correspondingly, the initial spread is fastest through that community of high-mixers. (Hello New York.) But this means as the disease naturally spreads, `R_0` is changing (if we stick with `R = R_0 (1-I)`).
To wit, here is the implied `R_0` (inferred from implied `R`--the actual growth rate in a given time and context) for our simulation and the actual 2017-2018 flu:
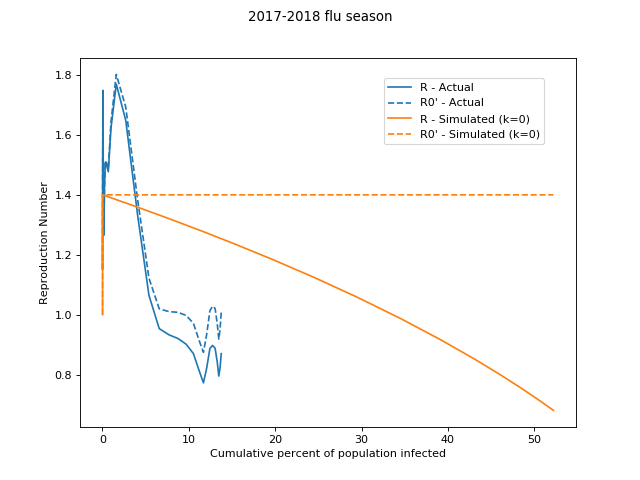
It seems more reasonable to use some `R_0'` which is a modified `R_0` based on the fraction already infected (through natural spread), `I`. As a really simple example we could use `R_0' = R_0 e^-(kI)`:
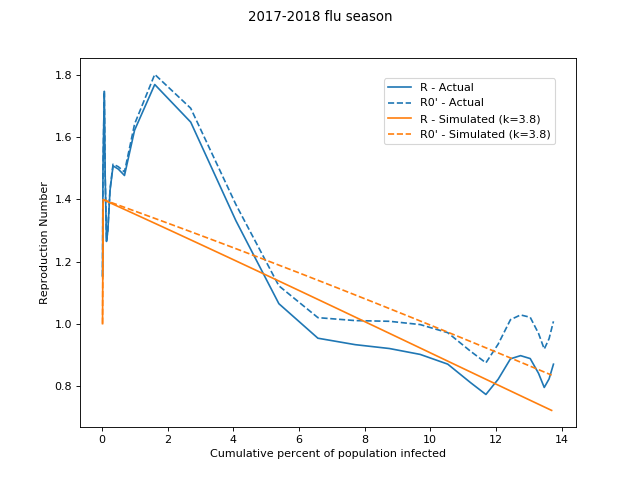
(We could instead define `R` as a different function of `I` but there is some sense in keeping a modified `R_0` instead, since the herd-immunity function via randomized vaccination still works using that modified `R_0'` at any point in time! [Update: On further consideration, it would have been cleaner and more general to have modified R directly instead of indirectly via R0, but they reduce to the same end result, and this way is somewhat more intuitive visually.])
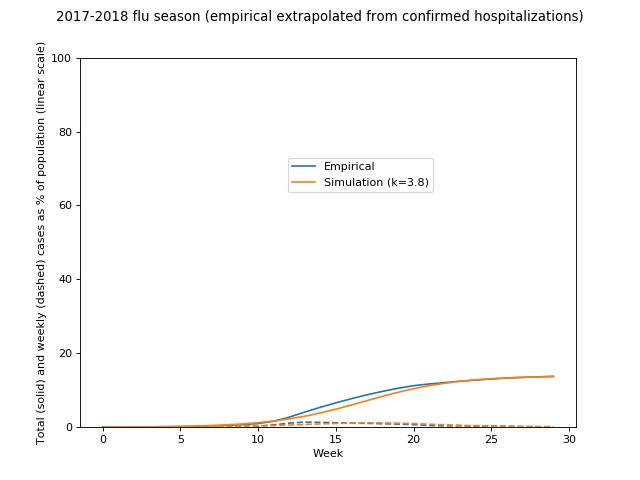
If we now re-run our flu simulation with this adaptive `R_0'` we get:
Or in linear space:
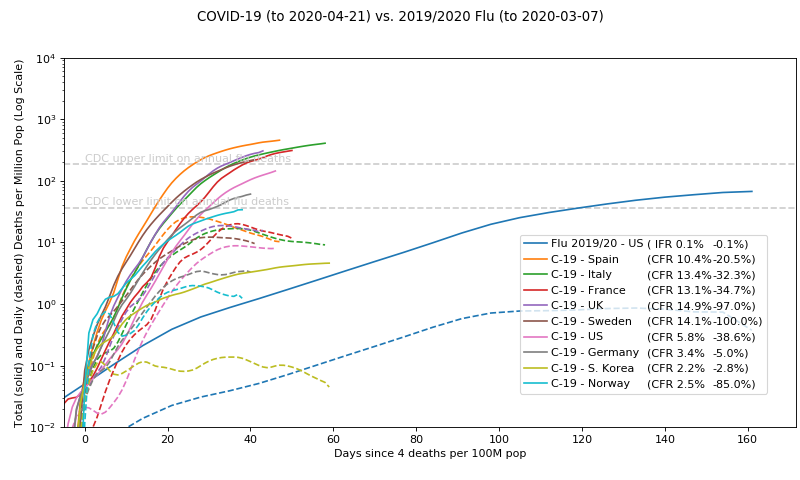
If we assume that mixing gradient is a property of the country, not the disease (in truth both would affect it), we can try re-simulating the COVID-19 spread accordingly:

Hmm, quite a difference!
Now, the take-away here isn't that this is a good model but rather to show how bad a model the original was, and how very sensitive these kinds of models are to the assumptions we put into them. Next time someone confidently declares that X number of people will be infected by the N'th generation, because `R_0` is Y and it's just simple math, duh! Well, send them here.
Which now raises the question everybody ought to want to know: What happens next with Sweden?
[Update, May 2: see Individual variation in susceptibility or exposure to SARS-CoV-2 lowers the herd immunity threshold posted today.]
[Update, July 24: see Herd immunity thresholds for SARS-CoV-2 estimated from unfolding epidemics posted today.]