Friday, January 29, 2021
Covid Update: Herd Immunity or Seasonality?
[I've been writing these updates without much elaboration on the thinking behind them. This time I'll be a bit more verbose -- apologies to those who prefer things concise.]
I'm seeing talk of Herd Immunity claims over the summer having been proven wrong, in light of clear Seasonality as the obvious explainer. It's possible both of these are wrong, and both of them are right. Or, more exactly, that: "both of them" is right.
It is a common misconception (and frequent straw man) that herd immunity is some universal threshold where a pathogen stops spreading. Let's build this up from first principles:
In a given context, one sick person, on average, will infect some number of other people before they are no longer contagious (whether because improved or dead). This number is typically called the reproduction number, or `R`. (Note that does not say anything about how long it takes for that one person to infect `R` others on average, just that it does, which means it is not directly inferable from the rate of spread alone.)
"On average" here means that yes, there's wild variation from case to case, but the law of large numbers says you can predict with some certainty that this average will be about the same between any two sets of equal contexts; and less so between contexts which are more different. In other words, as long as two places are similar enough in the ways that matter, you can reasonably expect their reproduction numbers to be the same.
So, an awful lot of modeling an epidemic comes down to meaningfully equating contexts, in order to infer when we can extrapolate `R` from one to another.
One common such equating is between the same place at two different times, such as near the beginning of the epidemic vs. in the middle vs. near the end. Setting seasons aside for the moment, this is generally a safe comparison because it's the same exact place, after all.
One thing is obviously changing, though: How many people have already had it and thus developed consequent immunity. To handle this, we parameterize `R` by time, calling that `R_t`, and then derive (by just considering what fraction of the people exposed will be unaffected due to existing immunity): `R_t = R_0 * (1-I)` where `R_0` is the reproduction number at the beginning of the epidemic, and `I` is the fraction already immune.
This all ignores who is infected. Are they an introvert or extrovert? Do they take public transportation every day? We brushed this off with the "on average" assumption--we accept variation from person to person, but figure the same mix of people exists in our analogous other context and so on average it all comes out the same. But one possible catch here is that the people that one person infects will also likely be similar to them--they might mostly infect people on public transportation, all of whom of course also tend to use public transportation.
Properly accounting for this gets a bit harder (probably requiring either simulation or, under a lot of simplifying assumptions, analytic solutions to systems of differential equations). However, back to the law of large numbers, as the numbers grow and the cases spread, they will spread fastest in the sub-contexts (sub-populations) in which they spread fastest. This tautology applied over time leads to those contexts dominating the numbers--i.e., over time the heat of the epidemic, regardless of where it started initially, will always migrate toward the populations where it spreads most easily.
So in that sense, it doesn't matter who is infected initially, it will settle into the same pattern soon enough. But it can introduce a variable delay, which is something to consider. (E.g., if it lands in old homes first, there might be an apparent fast start, but then it could peter out for a while because that's a very insular community as opposed to the large and heavily mixing public transporation using community. Still it's likely to trickle out to the latter eventually and once it does it takes off there and from that point forward it's following the "usual" course, just delayed significantly vs if it had dropped there first.)
This gradient within a context from lesser to greater spreading sub-populations, sometimes called dispersion, is not accounted for in the `R_t` formula above. I have posted previously about this, so won't go on about it again here. But briefly, again just mathematically following from the above, because the epidemic will burn through the population most quickly in the sub-contexts with highest `R_0`, over time (starting after the initial migration to the highest `R_0` sub-population) the infections-weighted average of (i.e., the effective) `R_0` will tend to decline with time, potentially significantly.
Which brings us to herd immunity:
Despite the WHO trying to rewrite all of science history by recently redefining herd immunity to be in terms of vaccines only, the concept is very old, and very simple: When the reproduction number `R_t` falls below 1, each infected individual infects less than one other (this much is a tautology) and so (it follows logically and mathematically and necessarily) the epidemic begins to die out. And more importantly, in that exact context, if it has completely died out but new cases are re-introduced, there may be some local flair ups (variation--some people might infect many while others few) but it will ultimately peter out rather than going exponential.
Now, if we ignore dispersion (as is commonly done), a little algebra shows that herd immunity is reached when the number immune equals `1-1/R_0`. For instance, if `R_0=3` then we reach herd immunity at 67%. Note, however, that this is just where the number of actively daily cases starts declining, which will take on the order of as long to get back to zero as it took to get to 67%, which means something a lot closer to 100% than 67% of the population would have been infected by the time it's all over. Ignoring dispersion.
If we account for dispersion, all of those numbers are a lot smaller for reasons I covered in prior posts, but that's not too important here. The dispersion-free formula above still qualitatively captures the relationship between `R` and herd immunity.
At `R_0<1` in a given context, herd immunity is at 0%. That is, the disease is incapable of spreading on its own and will never take off exponentially in that context. At just `R_0=1.1`, herd immunity is 10% (less with dispersion, but for a qualitative ballpark), and climbing rapidly with increasing `R_0`.
Why this matters is that there's nothing inherent to a disease itself about `R_0=1`. `R_0` is a property of the disease and the context (the particular population and setting), and so it will vary considerably from disease to disease and place to place, and there's no reason to expect it to be especially close to 1.
Put together with the above formula, this means that most of the time, we should expect herd immunity to be either 0% (which covers the entire vast region where `R_0<1`), or something substantial. That is: it's very unlikely for herd immunity ever to be a tiny fraction of a percent--that's just a very narrow target to hit by chance by a number affected by both the disease characteristic and the context. It will happen sometimes by chance, but not systematically. (Accounting for dispersion can soften this claim slightly, because a sufficiently strong gradient does expand the low-end probability space, but that's beyond the scope of this post and most people ignore dispersion entirely. Nonetheless, it's a caveat worth keeping in mind.)
Which brings us in a non-obvious way to Seasonality, which also changes `R_0` over time. It may be the same place in the summer and winter, but sunlight, temperature, vitamin-D, commuting habits, diet, and so on, all change with the seasons, especially at the higher latitudes. This means the herd immunity threshold is going to change, potentially substantially.
Assuming the usual case where winter is worse and summer is better (which can be reversed somewhere so hot that winter is the outdoors season), there are two qualitatively different regimes to consider: One where `R_0<=1` in the summer, and one where it is not.
If `R_0<=1` in the summer (but presumably not in the winter or we wouldn't be talking about it at all), then the disease can be said to be truly seasonal, in the sense that it just won't spread in the summer, ever. (I'm just pointing out the obvious here, not making any claims about the way these terms might be formally used by others.)
If, on the other hand, `R_0>1` in the summer (but, typically, still notably lower than in the winter), then we might call this semi-seasonal, in the sense that it will spread in both seasons but the herd immunity threshold will be lower in the summer than in the winter.
Now calling upon the observation above that in any event herd immunity is unlikely to be a tiny fraction of a percent, rather usually either zero or something in the whole percentages, we should expect an unfettered semi-seasonal epidemic that starts in the spring or summer to have a substantial first wave that peters out after hitting summer level herd immunity in the whole percentages, followed by--if it didn't overshoot this already during cool down--a second winter wave which peters out after hitting winter level herd immunity.
The key point there is that it's very unlikely that the second wave will be categorically worse than the first, because if there was a first wave at all in the summer context, it is most likely going to burn all the way into the whole percentages, which is already a million times worse than when it started and only an order of magnitude or so from where it has to stop.
Now set aside natural seasonality for a moment, and consider that mitigations like mask wearing and lockdowns are very much analogous to seasons: They are changes in the context which are going to impact `R_0`. The same logic applies with the same result: Mitigations are either going to turn it around (`R_0<1`) or not (`R_0>1`), and if they don't, most of the time the epidemic will continue to spread until hitting a (mitigated) herd immunity in the whole percentages.
In other words, either mitigations are drastic enough to stop the thing, or they aren't going to really kick in until you're pretty close (within an order of magnitude) to burning out naturally anyway. And that's if they're implemented consistently and without letting up, because letting up is like changing seasons and you just lose more ground until eventually you hit natural herd immunity anyway.
What is a practical mitigation policy varies wildly with context. Island (or equivalent) nations, for instance, have a lot of options that more porous ones don't. And in particular, island nations can practically maintain extreme mitigations if they start them early: For instance, you could just throw anyone infected, and anyone they came into contact with, into a furnace, and if this is started early enough, the number of people affected would be tiny so mostly life would go on as normal. Or, you know, you could quarantine them or whatever. That's an extreme policy that might drive `R_0<1` at any stage of an epidemic, but it's not practical once the numbers are large. And, in general, it may be that there are no sustainable mitigations available to countries with porous borders, or who were too far along before they knew it, which could drive `R_0<1`. That leaves only the other option--mitigations leaving `R_0>1`--which is close enough in outcome to doing nothing that one should carefully weigh the costs since they could quickly overwhelm the relatively modest benefits.
This all begs the question: How can you tell whether your mitigations (or season) have pushed `R_0<1` vs that you have hit herd immunity at some `R_0>1`? And in the latter case, how much impact did the mitigations have?
Here's the graph I started plotting last spring (John Hopkins data, mostly unchanged set of countries), but aligned by date instead of by per-country take-off:
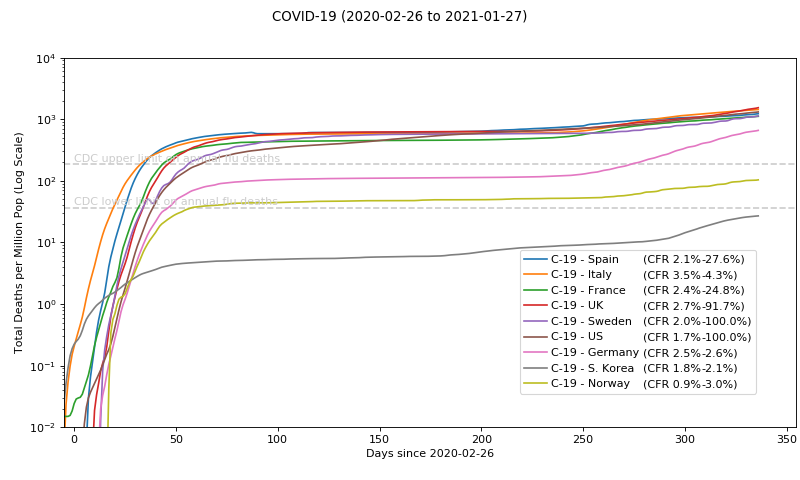
To put a scale on this, at per-million on the left that means that the top of the graph at `10^4` is 1% of the population dead. At `10^3` it's 0.1% of the population dead, or 1 in 1000 people. (This sounds extreme until you consider it is mostly people near end of life already, and with an average lifespan near 80 we should expect on the order of one in 80 people dead per year a priori, many of whom are primed to die of Covid should they get it.)
Getting `R_0<1`, whether by mitigations, season, or both, should cause a divergence in this graph since both seasons and mitigations vary wildly from place to place. Conversely, convergence, specifically at the top, implies herd immunity at some common effective `R_0`. Clearly we see convergence at the top.
Furthermore, since fractional herd immunity levels are unlikely, anyone far enough down on this graph has probably managed `R_0<1`, whereas those separate from the pack but nearer the top may have hit herd immunity at some `R_0` coincidentally very near 1, and/or, because this is deaths not cases, they may have substantially better treatment practices or substantially different reporting criterion (e.g. some may be death of Covid while others may be death with Covid).
So, South Korea (not coincidentally a defacto island nation) quite likely held `R_0<1` initially, but we see that slipping now in the winter where the baseline `R_0` is higher. Germany and Norway, looking at the timing, may have simply benefited from a late start initially and then hit `R_0<1` between mitigations and summer just in the nick of time. Germany is now converging on the rest, which makes it ultimately unremarkable, while Norway remains a bit of an outlier for reasons that may or may not ever become apparent.
The key thing to note is how tightly clustered they all are at the top, which is hard to explain as anything other than herd immunity. Some claim this is a sign of countries adapting to their death rates but it's seems unlikely there's anything so special about that particular value, especially with it moving over time as it is. The burden of proof is on the causal claim: The null hypothesis here is that mitigations do little or nothing, so the theory that the mitigations make a big difference needs to explain the data better than that. Here we have a wide array of countries which have practiced a wide array of mitigations, and there is no obvious difference save for a few outliers like Norway which have no obvious explanatory difference anyway (nothing in the "mitigations matter" theory would have called out Norway a priori as an outlier).
Here is the same plot as daily deaths, linear scale:
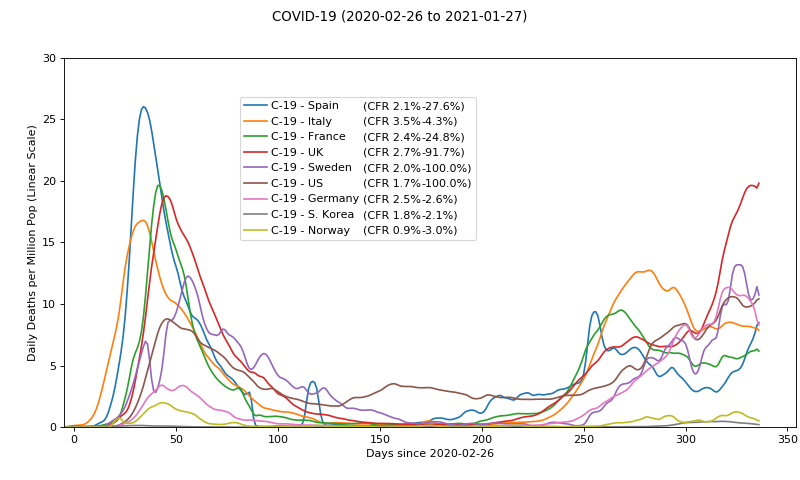
One trouble with this second wave is it's hard to tell what are deaths from Covid and what are deaths with Covid, since the testing methods have been perverted to such an extent that they may well be picking up fragments of dead viral DNA from the environment. Iirc, the WHO and FDA both recently issued modified guidelines to reel in (or at least to disclose) these PCR cycles (exponential pre-amplification of samples), so we may see apparent case counts, as well as apparent deaths due to Covid, dropping soon for this reason alone. But I digress.
It remains to be seen where we go from here, but for the reasons outlined above, wherever these curves turn over, I expect they will head down once and for all and stay down, unless Covid proves to be a sufficient mutator as to significantly evade prior exposure. (We'll see...)
For reasons somewhere between intuition and hope, I expect these curves to turn down soon. Conversely, if they don't turn down before the weather improves, then it leaves open the possibility of a third wave next winter, which I would imagine would be slower (just like the second was slower than the first) due to the effect of existing immunity on `R_t`, and milder due to that combined with the same winter season duration as the prior wave. (Again discounting mutations, and ignoring changes in mitigations.)
Within the US, back in August things looked like this (tails show recent movement):
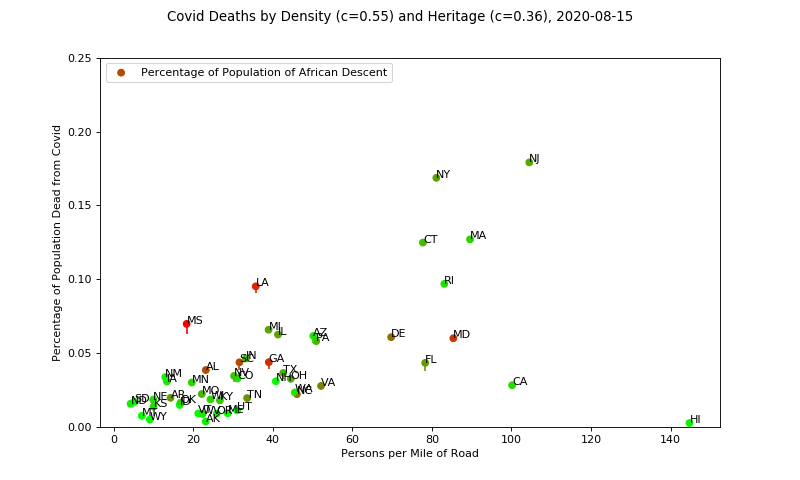
An obvious interpretation here is that the lower density areas have significantly lower `R_0` and so hit herd immunity at a lower threshold. However, it's been observed that lower density areas tend to get hit nearly as hard (by other epidemics in the past, including the annual flu), just later. This looks to be the case here, as this is today:
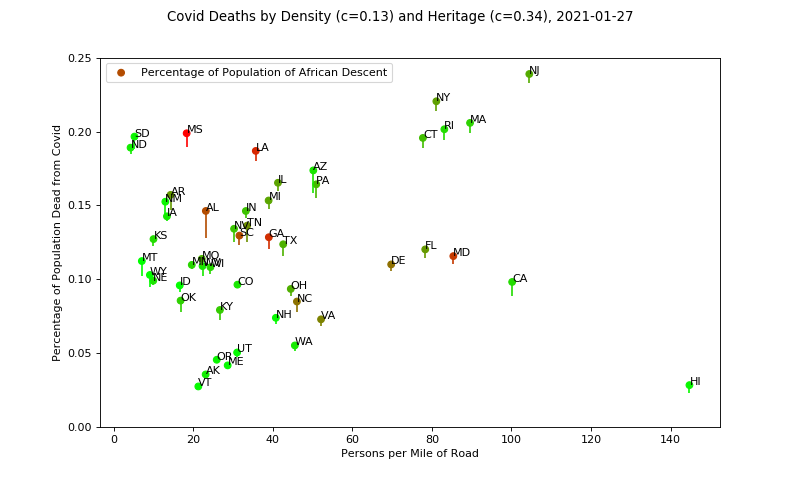
It will be interesting to see where these end up long term, especially California and Hawaii. Once again, no obvious correlations with mitigations, except that California does seem like an outlier (so far) and also has the current reputation as having the most draconian lockdowns, so they may be the poster child for successful mitigations unless they catch up with the pack (though still only under the dubious assumption that population density ultimately matters). There's a lot of negative news about California having the most cases right now, but that is not population-adjusted so is propaganda not news. Again I am ignoring Hawaii since they are not just an island but five+ separate ones. Hawaii stands to be the state that most benefits from the vaccines, whatever benefit that may be. (And possibly the other low-liers, if population density is not ultimately relevant.)
It's still early to review my past predictions, but a preview of a few important ones:
The most relevant/actionable claim I made is that sustainable lockdowns don't help (much) and that everywhere was going to end up hitting herd immunity eventually. This is by contrast to people who were predicting that the states and countries with firm lockdowns would have it sewn up by fall (Europe was explicitly mentioned as a sure winner here), whereas the ones that don't would be suffering significantly more cases and deaths (variously the US as a whole, or just the republican run states, were thrown into this category).
Whether or not herd immunity is involved (something far from certain even though strongly implied by the top clustering in my opinion), it is pretty clear that there's no obvious difference between Europe and the US, or between the countries with harsh mitigations and the ones with few or likewise between the US states. The UK in particular has been bonkers with their lockdowns for a while now and it clearly hasn't put them ahead of the pack (well, it has, but in the wrong direction!). Germany, once the darling, is rapidly converging on the pack. So, thus far I'd say I was spot on with this one, but it's not over yet.
A more speculative prediction I made was that Sweden's second wave, if any, wouldn't be substantially worse than the first. And more recently I said I expected it to turn soon. I'm on the verge of losing that bet, unless it turns around now (there are some early indications it has, but early indications can prove false), and I certainly didn't nail it in any event since we're already far from "if any".
The more important claim I made about Sweden is that their total excess deaths (I think I specified a two year trailing average to make up for dry tinder, but I'll have to go look) would be the same or lower than the rest. People like now to compare them to Finland and Norway, but at the time I originally made the claim people were happy to compare them to, say, the UK who were clearly going to be applying heavy measures throughout. I'm referring here to total excess deaths--not just those attributed to Covid--and those are fairly delayed in the accounting so it will be a while before we can really look at these, but I hope to soon since it will be a much more objective comparison of places, and will put a lot more perspective on just how bad Covid is or isn't in the grand scheme of things.
In other random news, I mentioned HCQ previously, which is very slowly re-gaining acceptance. More recently ivermectin has entered the stage as superior to HCQ, especially in showing benefit at later stages not just early. Both remain mysteriously blacklisted in countries that have a lot of money to spend on vaccines, but are in wide and seemingly effective use in numerous poorer countries. Conclude what you will.
I will not opine on the Covid vaccines--third rail and all that.
Sorry for the length, but I thought it might be useful to "show my work" a little more than usual. (Still a lot I left out, like the multiple simulations I've been running to see how all of these various parameters impact an assortment of randomly different populations and such... But if I went there this post would be ten times as long.)
Personally I think the most important thing you can do to lower your chances of having a severe to deadly case of Covid is to take ~4000IU vitamin D3 every day (well in advance of getting Covid--your body needs weeks to convert it into the active form!). Sadly the UK was recently clueful enough to start sending vitamin D to everyone for this reason, but still clueless enough to send 1/10th the useful dose. I imagine it will be used to "prove" that vitamin D doesn't help. Whatever--haters gonna hate.